
What Percentage of Google Searches Have AI Overviews? The 80% Headline vs. Local Search

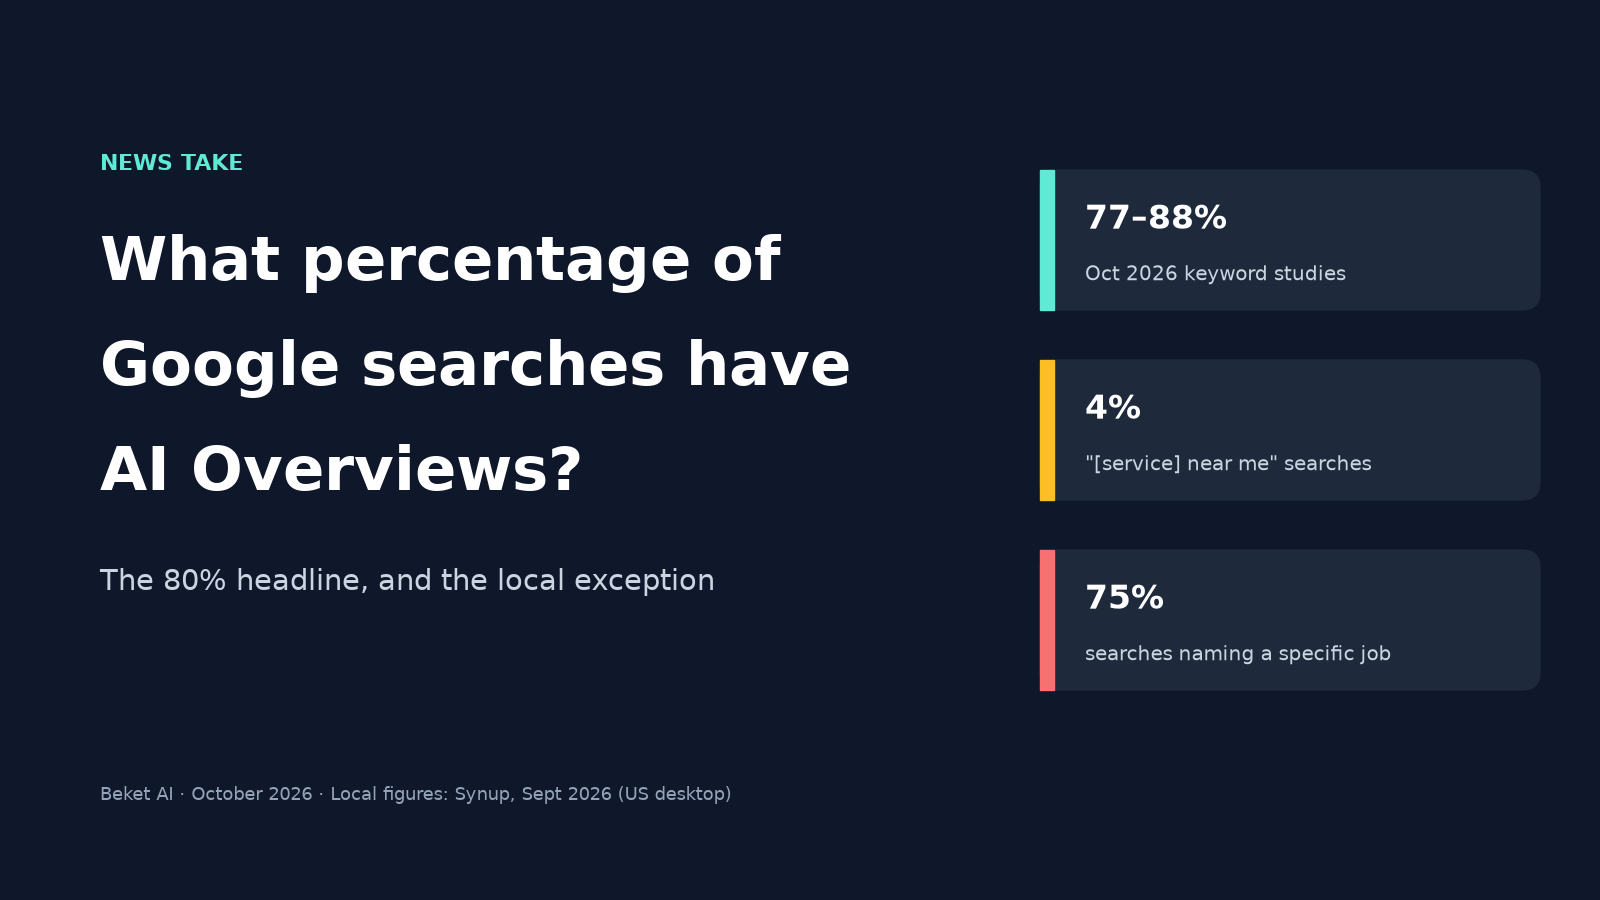
Short answer: it depends on which searches you count. Several studies published in October 2026 put AI Overviews on 77% to 88% of the keyword sets they tracked in the US, and on 82.5% of US brand searches. But a September 2026 study of local searches found them on just 4% of “[service] near me” pages and on 75% of pages where the searcher named a specific job.
So the “over 80%” headline is real. It just doesn’t describe every search a customer makes, and it says the least about the searches local businesses care about most.
On October 26, Search Engine Roundtable reported that AI Overviews now show up for over 80% of Google searches, pulling together new data from Semrush, SE Ranking, and seoClarity. Below, we line those studies up side by side, explain why their numbers disagree, and look at what the local data means if you run a service business.
The numbers, and what each one counted
Every figure below is a share of a sample, not a share of all Google searches. Google doesn’t publish an official rate. Each study picked its own keywords, location, and device, and that choice drives the result more than anything else.
| Study | When | What was sampled | Share with an AI Overview |
|---|---|---|---|
| Pew Research Center | March 2025 | 68,879 real Google searches by 900 US adults who shared their browsing data | 18% |
| seoClarity, as reported by Search Engine Roundtable | About September 2026 | seoClarity’s tracked queries | Over 62% (55% to 84% by industry) |
| Serplify | October 9, 2026 | 494 US desktop searches across seven query types | 77% |
| Ahrefs | September 2026 average | US desktop non-branded keywords (part of 232.8 million crawls) | 78.3% |
| SE Ranking | October 2026 | 1,000 US brand keywords, each checked three times on desktop | 82.5% |
| Semrush | August 2026 | 400 US desktop commercial keywords (banking, software, ecommerce) | 88% (97.08% weighted by search volume) |
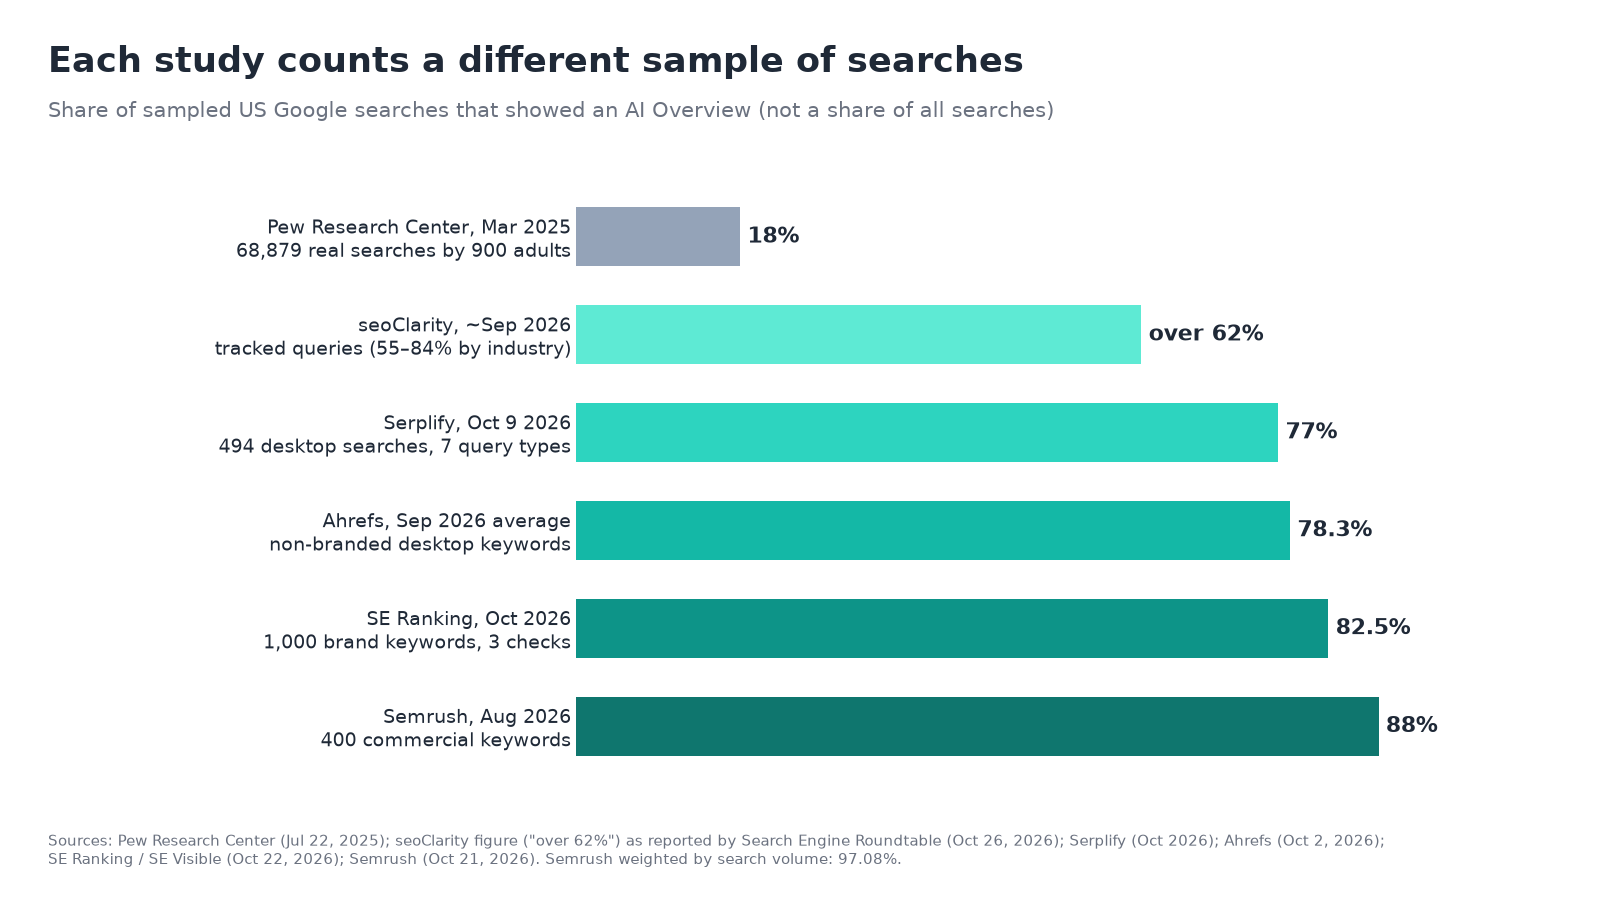
Two things stand out.
The direction is the same everywhere. Semrush’s commercial keywords went from 45.75% in September 2025 to 88% in August 2026. Ahrefs saw branded keywords climb from 61.3% in July 2026 to 73.3% in September, and non-branded from 73.5% to 78.3%. Pew’s 18% measured real searches in March 2025, before most of this growth. None of these datasets shows AI Overviews pulling back.
The highest numbers come from buying-stage searches. In Semrush’s data, “best X for Y” searches had an AI Overview 96.12% of the time, and “reviews” searches went from 30.14% to nearly 90% in a year. In Serplify’s sample, 97% of question searches and 97% of comparison or “best” searches had one. These are the searches where people choose who to buy from.
Why the studies disagree
If you see one article quoting 18% and another quoting 88%, they’re usually both right about their own sample. A few things move the number:
- Which keywords. A panel of commercial or question keywords will show far more AI Overviews than a mix that includes short, navigational, or local searches. In Serplify’s sample, brand and website searches had an AI Overview 59% of the time, and local searches 34%.
- Keywords vs. real searches. Most studies count keywords. Pew counted what people actually typed, which includes lots of short searches. In that study, AI summaries showed on just 8% of one- or two-word searches.
- Weighting. Semrush’s 88% treats every keyword equally. Weighted by search volume, it rose to 97.08%, because the busiest keywords were more likely to trigger an AI Overview.
- Country. SE Ranking found AI Overviews on 82.5% of US brand searches but 40.4% in Germany, using the same method. None of these studies measured Canada, so don’t assume the US rate applies to Vancouver searches.
- How the page was collected. Synup reports that a standard HTML scraper detected AI Overviews on about 1% of its local pages, while a browser that fully loaded the page found them on up to 75.4%. A study that doesn’t say how it rendered pages can badly undercount.
- Day-to-day change. In SE Ranking’s three checks, 11.4% of US brand keywords switched between showing and not showing an AI Overview. Any single check is a snapshot.
The local exception: how the customer phrases it decides
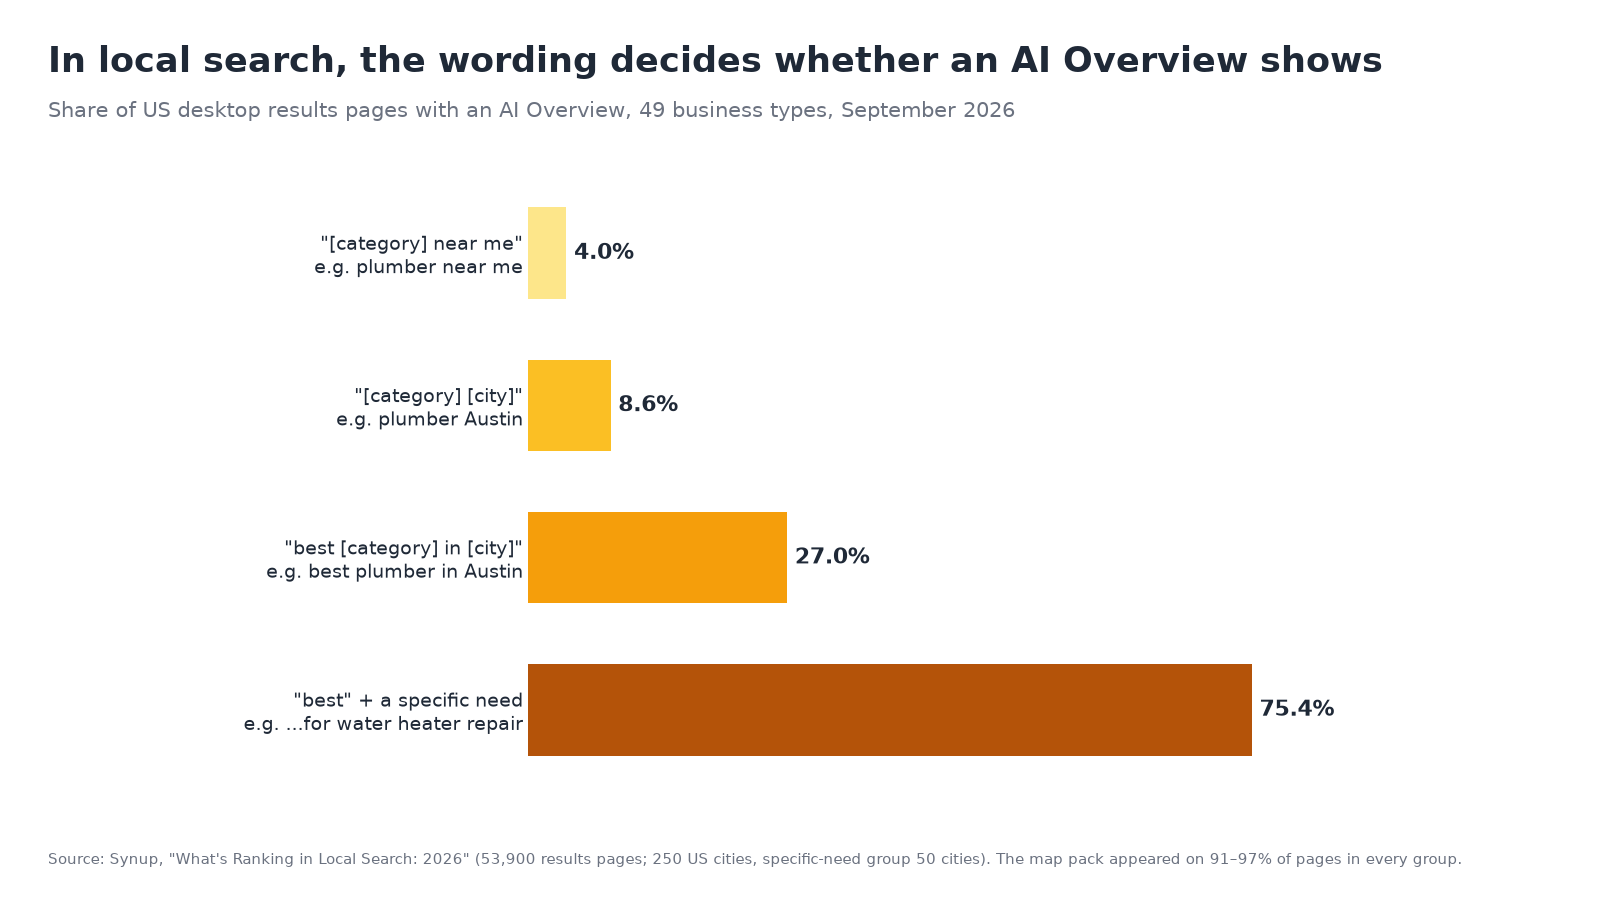
The largest local dataset we found comes from Synup’s “What’s Ranking in Local Search: 2026”. Synup pulled 53,900 Google results pages in September 2026 for 49 kinds of local business across 250 US cities, and searched each one several ways. The map pack showed up on 91% to 97% of pages no matter how the search was worded. The AI Overview did not.
| How the search was phrased | Example | Pages with an AI Overview |
|---|---|---|
| “[category] near me” | plumber near me | 4.0% |
| “[category] [city]” | plumber Austin | 8.6% |
| “best [category] in [city]” | best plumber in Austin | 27.0% |
| “best” plus a specific need | best plumber in Austin for water heater repair | 75.4% |
Source: Synup, September 2026, US desktop. The specific-need group covered 50 cities; the others covered 250.
Read that table as a customer journey. Someone who types “plumber near me” mostly sees the map pack, and often ads. Someone who types what they actually need is, three times out of four, looking at an AI answer first.
Synup also found that the AI Overview on these searches is often a mini business list. On specific-need searches, 48% of AI Overviews included business cards with a phone number, rating, and Call, Directions, and Website buttons. Synup says the cards it spot-checked didn’t always list the same businesses as the map pack below them.
It also depends on the trade
The rate on “best [category] in [city]” searches swings widely by business type. Here are the categories closest to the local services we’ve studied, plus a few for contrast:
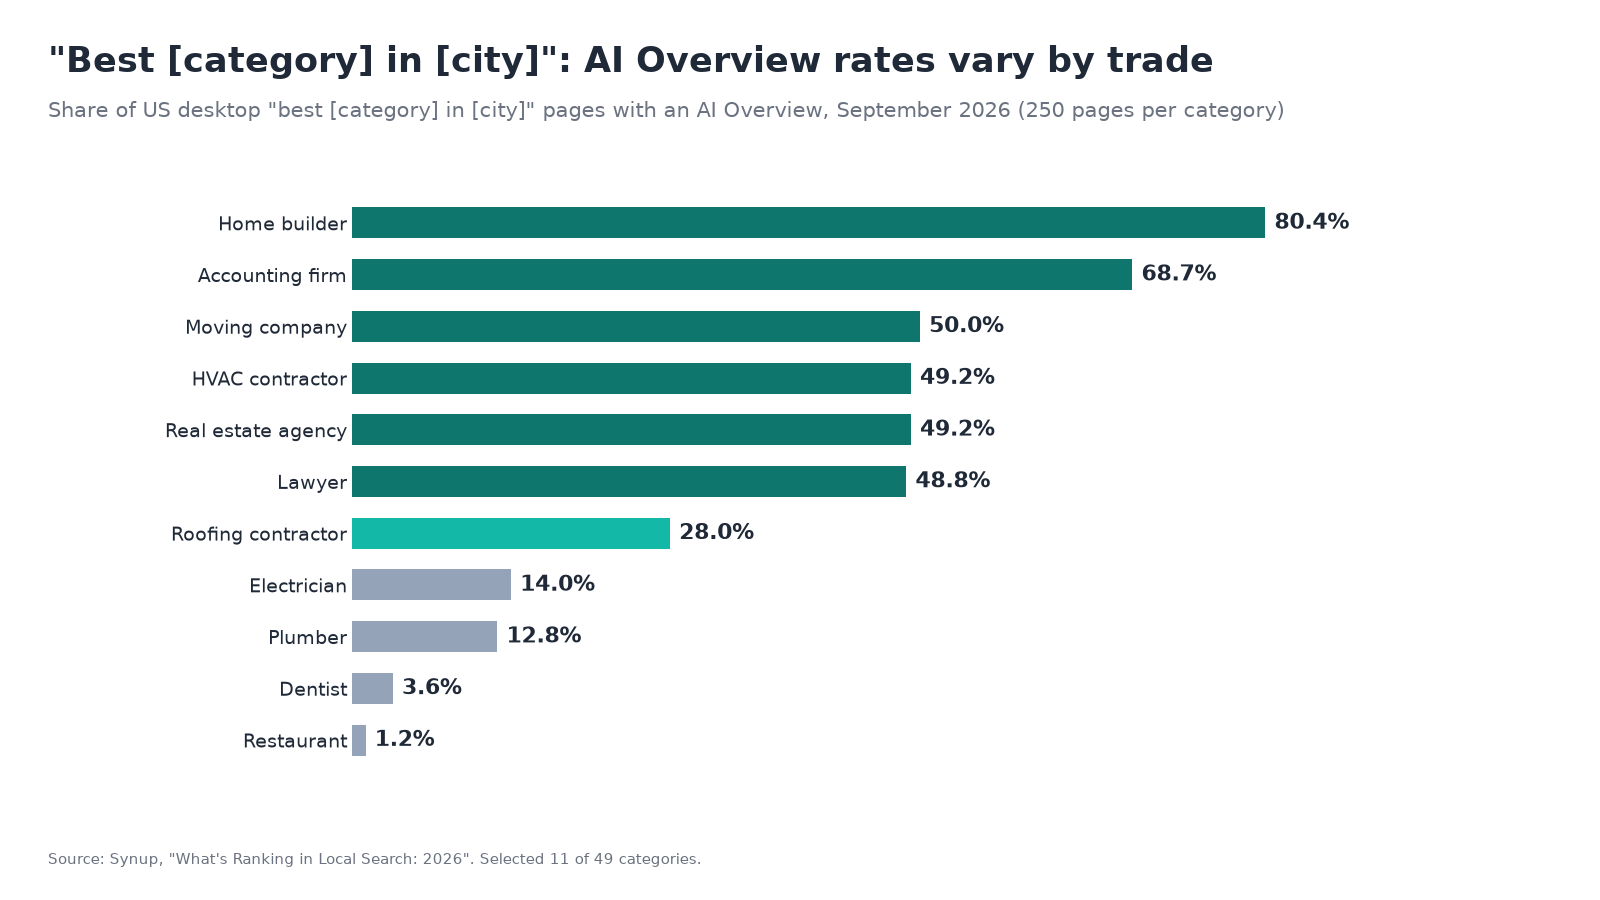
Synup’s read is that AI Overviews cluster on considered, higher-cost decisions such as who builds your house or does your taxes. For dentists, only 3.6% of “best” pages had an AI Overview, but 62% had a forum block. And the low categories can flip once a specific job is named: for plumbers, “for water heater repair” triggered an AI Overview on 98% of pages, against 32% for “open 24 hours.”
What this means if you run a local business
Don’t take the 80% at face value, and don’t dismiss it either. For a plumber or dentist, a plain “near me” search still mostly means the map pack, and often ads. But the searches where a customer spells out the job, or asks for the best option, are where AI Overviews now dominate. Those customers are likely closer to booking.
Your Google Business Profile now feeds two surfaces. Synup found that Google Business Profile links were the most cited source in local AI Overviews (13,777 citations), and that on “[category] [city]” searches 61% of citations pointed to the business itself: its own site, its chain’s site, or its profile. Synup calls the AI Overview “built on the same profile data as the map pack.” Keeping your hours, services, and categories accurate matters for both. Our guide to adding LocalBusiness schema markup covers the website side of the same job.
Pages for specific jobs matter more than they used to. SE Ranking found that 62.2% of the brand-site pages cited in US brand AI Overviews weren’t in the organic top 10 for that search, including 92.6% of cited product, service, and category pages. Serplify found only 26% of cited links were top-10 results. Ranking first for your homepage isn’t the whole picture anymore. A clear page for each service you offer gives Google something specific to cite when a customer names that service.
Appearing isn’t the same as being clicked. None of these studies measured traffic. Pew found people clicked a link inside an AI summary on just 1% of visits to search pages that showed one. That doesn’t make AI Overviews irrelevant, as we argued in why small AI search traffic still matters, but it means you should measure them on their own terms. Here’s how to track AI Overview traffic in Search Console and GA4, and what those tools still can’t show.
Check your own searches, not the averages. Every number above is an average across thousands of businesses. Whether an AI Overview appears for “best roofer in Seattle for a flat roof,” and which businesses it names, is a question about your market. In our Seattle plumbers study, three AI engines named 23 different plumbing businesses across 21 everyday questions, and no single plumber got more than 12% of the mentions.
What we’re watching next
- Better local numbers outside the US. None of the studies above covered Canada, and the US-Germany gap shows markets can differ a lot.
- Repeat measurements. Synup plans a one-week re-fetch to measure volatility, and SE Ranking’s data already shows a slice of keywords flipping between checks.
- Click data from Google. Search Console’s Generative AI report counts AI impressions but not AI-only clicks. Until that changes, appearance rates will keep getting more attention than outcomes.
If you want to see which local businesses AI answers name for the questions your customers ask, Beket AI’s free audit runs 25 prompts across 3 AI engines. Beket AI Pro ($49/month) re-runs the audit daily, starting at 50 prompts across 3 engines, so you can see how answers change over time.
Related posts
How to Track AI Overview Traffic in Search Console and GA4 (and What You Can't See)
A step-by-step guide to tracking Google AI Overview and AI Mode traffic with Search Console's Generative AI report, GA4, and manual checks, plus a checklist.
Which Vancouver Lawyers Does AI Recommend? 2026 Study
Fasken led 210 AI mentions of Vancouver law firms on October 23, 2026. See who ChatGPT, Perplexity and Google AI Overview named, and how.
llms.txt vs robots.txt vs Schema Markup: What Each One Does for AI Search
llms.txt, robots.txt and schema markup compared: what each file does, which AI systems read it, what Google says, and which one to fix first.